


The pandemic’s impact on employment is undeniable, as job losses in the spring of 2020 were comparable to those of the Great Depression. However, unlike previous recessions, the recovery was swift: more than 60% of lost jobs were recovered a year later, and total employment today is just one percentage point below its pre-COVID-19 peak. However, while many localities reported solid job growth, others have experienced little to no growth over the past year, and some remain well below their March 2020 figures. Researchers ranked the metrics based on the percentage change in employment between March 2021 and March 2022.
Employment in the Salem metropolitan area has grown 3.3% year-over-year, representing a 0.5% increase since the start of the pandemic.
Nationally, many key U.S. employment indicators are similar to those before the COVID-19 pandemic, with strong job growth contributing to this. However, the impact of the coronavirus on employment is undeniable. Data from the U.S. Bureau of Labor Statistics shows that job losses in the spring of 2020 were comparable to those of the Great Depression. The unemployment rate reached nearly 15% at the time; however, unlike previous recessions, the recovery was swift. More than 60% of lost jobs returned a year later, and total employment today is just one percentage point below its pre-COVID-19 peak.
According to new data from the U.S. Bureau of Labor Statistics, from March 2021 to March 2022 there were reductions in unemployment rates in 386 of America’s 389 metropolitan areas, and 108 of those areas had jobless rates under 3.0%. In March 2022, the national seasonally-adjusted unemployment rate was 3.6%, down 2.4 percentage points from the year prior. Similarly, data from the Economic Innovation Group shows that over half of all U.S. metros that experienced job losses during the coronavirus pandemic are on target for full recoveries in the next year.
On the state level, Nevada and California added the most jobs last year, with respective 9.1% and 6.4% increases, each showing a significant rise over the year prior. From March 2022 to March 2020, Nevada had a 0.1% increase in employment, while California had a 0.6% decrease during that two-year period. This means that when compared to the start of the pandemic, employment numbers in these two states are relatively flat. Hawaii also had a dramatic rebound over the past year, with a 6.3% increase from March 2021 to 2022; however, its total employment numbers are still 8.5% below March 2020 levels.
Unlike the three aforementioned states, which were particularly hard hit by the decline in travel and tourism, Texas and Florida experienced remarkable and consistent growth in both periods. Employment in each state grew between 5.7% and 5.9% over the past year, and both are approximately 2.5% higher than March 2020 figures. Although to a lesser extent, the same is true in Georgia, which saw employment increase by 5.2% over the past year and 2.2% over the past two years.
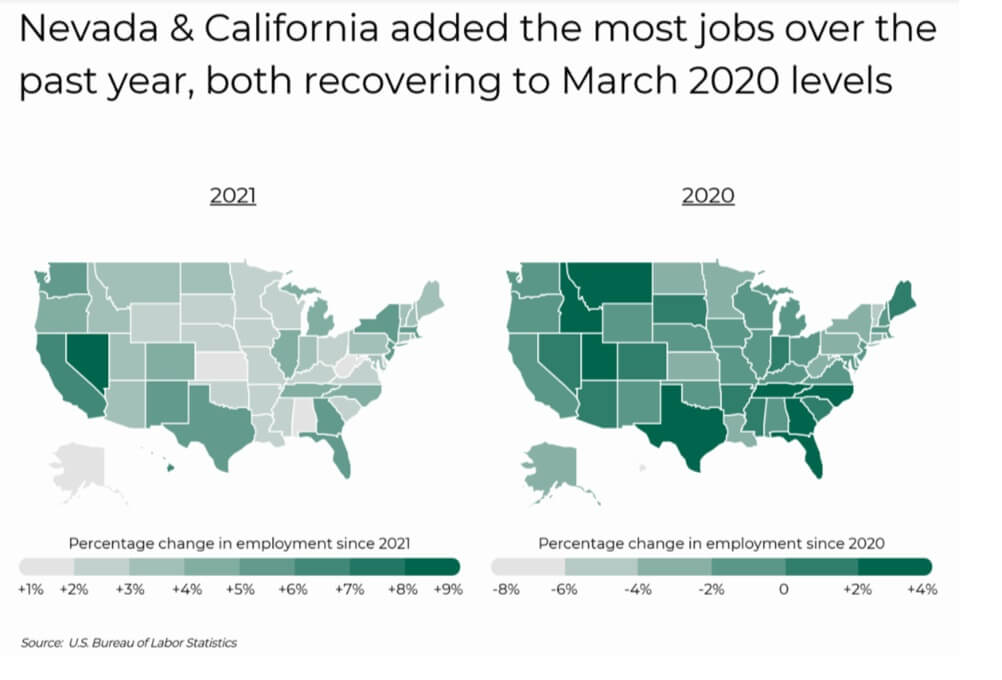
Similar trends hold at the local level with select cities in Nevada, California, Texas, Florida, and Georgia reporting robust employment growth. On the other hand, many locations in the South and Midwest have experienced little to no employment growth over the past year, and remain well below March 2020 numbers.
The data used in this analysis is from the U.S. Bureau of Labor Statistics Current Employment Statistics dataset. To determine the locations with the most employment growth, researchers at Filterbuy calculated the percentage change in employment between March 2021 and March 2022, considering only metropolitan areas with at least 100,000 residents. In the event of a tie, the location with the greater total change in employment since March of 2021 was ranked higher.
The analysis revealed that employment in the Salem metropolitan area has grown 3.3% since last year, representing a 0.5% increase since the start of the pandemic. A summary of the data is presented below.
Salem, OR metro area:
- Percentage change in employment since 2021: +3.3%
- Total change in employment since 2021: +5,500
- Percentage change in employment since 2020: +0.5%
- Total change in employment since 2020: +800
- Current unemployment rate: 3.8%
For reference, here are the statistics for the entire United States:

- Percentage change in employment since 2021: +4.5%
- Total change in employment since 2021: +6,494,000
- Percentage change in employment since 2020: -0.1%
- Total change in employment since 2020: -81,000
- Current unemployment rate: 3.6%
Below is a summary of the analysis with data for the Salem, OR metro area; feel free to use the link, which includes a table with data from over 350 meters and all 50 states:http://www.filterbuy.com/resources/cities-with-most-employment-growth
